
How the World's Energy Mix Shifted Over Two Centuries, and Where It Goes Next
The phrase "energy transition" implies a clean handoff from one source to the next, but the historical record shows something messier. Over the past two hundred years the world has added new energy sources far more often than it has replaced old ones, and the share held by each source has moved slowly, over decades rather than years. Understanding how those percentages actually evolved matters, because it sets a realistic baseline for reading the projections about where the mix goes next.
One point needs stating up front, because it trips up almost every comparison. There is more than one way to convert wind, solar, hydro, and nuclear electricity into a "primary energy" figure comparable to the heat content of coal, oil, and gas. The substitution method inflates non-fossil electricity to account for the fuel a thermal plant would have burned to produce it, while the direct method counts only the electricity itself. This is why you will see the 2024 fossil share quoted as roughly 81 percent in some sources and closer to 87 percent in others. Neither is wrong; they are measuring the same reality with different accounting. Our World in Data explains the two conventions and their consequences in detail in its note on how to compare energy sources, and this post flags which basis is in use where it matters.
Biomass dominated for almost all of human history
For most of the period before 1800, the global energy mix was close to homogeneous. Traditional biomass, meaning wood, crop waste, and charcoal, supplied the overwhelming majority of energy used anywhere in the world, alongside human and animal muscle. As late as 1870, biomass still accounted for around 80 percent of total energy consumption, a figure visible in the long-run global energy substitution series that stitches together historical estimates with modern statistics. There was no meaningful transition happening because there was essentially nothing to transition to.
What makes this period instructive is not the biomass share itself but the pace of what followed. The shift away from biomass, once it began, took the better part of a century to play out, and it did so not because biomass ran out but because a denser, more useful energy source became available at scale. Vaclav Smil's Energy Transitions: Global and National Perspectives remains the standard reference on just how long each of these shifts took, and its core finding is uncomfortable for anyone hoping the next one moves quickly: no primary fuel has ever gone from a few percent of the global mix to a dominant share in less than fifty to sixty years.
Coal and the first real transition
The Industrial Revolution introduced the first genuine change in the energy mix. Coal's share climbed from under 2 percent in 1800 to nearly half of global energy by 1900, driven by the steam engine and by household heating and cooking. Even at the turn of the twentieth century, though, the transition was only half complete: around half the world's energy still came from biomass while the other half came from coal.
By the First World War, coal's share had peaked at roughly three quarters of global primary energy. This is worth holding onto as a reference point, because it represents the single largest share any modern fuel has ever held, and it took a full century of industrialization to get there. The coal transition is the fastest large-scale energy shift in the historical record, and it still measured in decades. It is also worth noting that coal never went away: the IEA's coal market reporting shows global coal demand setting successive record highs in the 2020s, more than a century after its share of the mix peaked.
Oil and gas: adding rather than replacing
Oil followed a slower path to prominence than its eventual importance suggests. The first commercial oil well was drilled in Pennsylvania in 1859, but for its first several decades oil was used mainly for lamps rather than as a major energy source. It was the internal combustion engine, mass-produced automobiles, and the post-war surge in vehicle ownership that turned oil into a dominant fuel, and its share climbed steeply through the middle of the twentieth century. Natural gas rose alongside it as pipeline networks spread and gas became practical for home heating and cooking.
The combined effect is telling. Fossil fuels together reached roughly 77 percent of the mix by 1973, when the first oil crisis briefly interrupted the trend and pushed some demand back toward coal and toward the newly emerging nuclear sector. Nuclear power, which had only entered the mix in the 1960s, tripled its share of primary electricity between 1973 and 2000; the IEA's nuclear power tracking covers how that build-out stalled and where it is restarting. But the broader pattern across the whole period is that each new source was largely added on top of existing consumption rather than substituted for it. Total energy demand kept growing, so even sources losing share in percentage terms often kept growing in absolute terms.
Where the mix stands today
The current picture depends on the accounting basis, but the shape is clear either way. Global primary energy consumption reached a record high in 2024, on the order of 592 to 620 exajoules depending on the source and method. Fossil fuels still supplied the large majority: under the substitution method, around 81 percent as of 2023, and under the direct method used in the most recent Energy Institute Statistical Review of World Energy, roughly 87 percent for 2024, with oil the largest single source at about a third of the total, followed by coal and then natural gas.
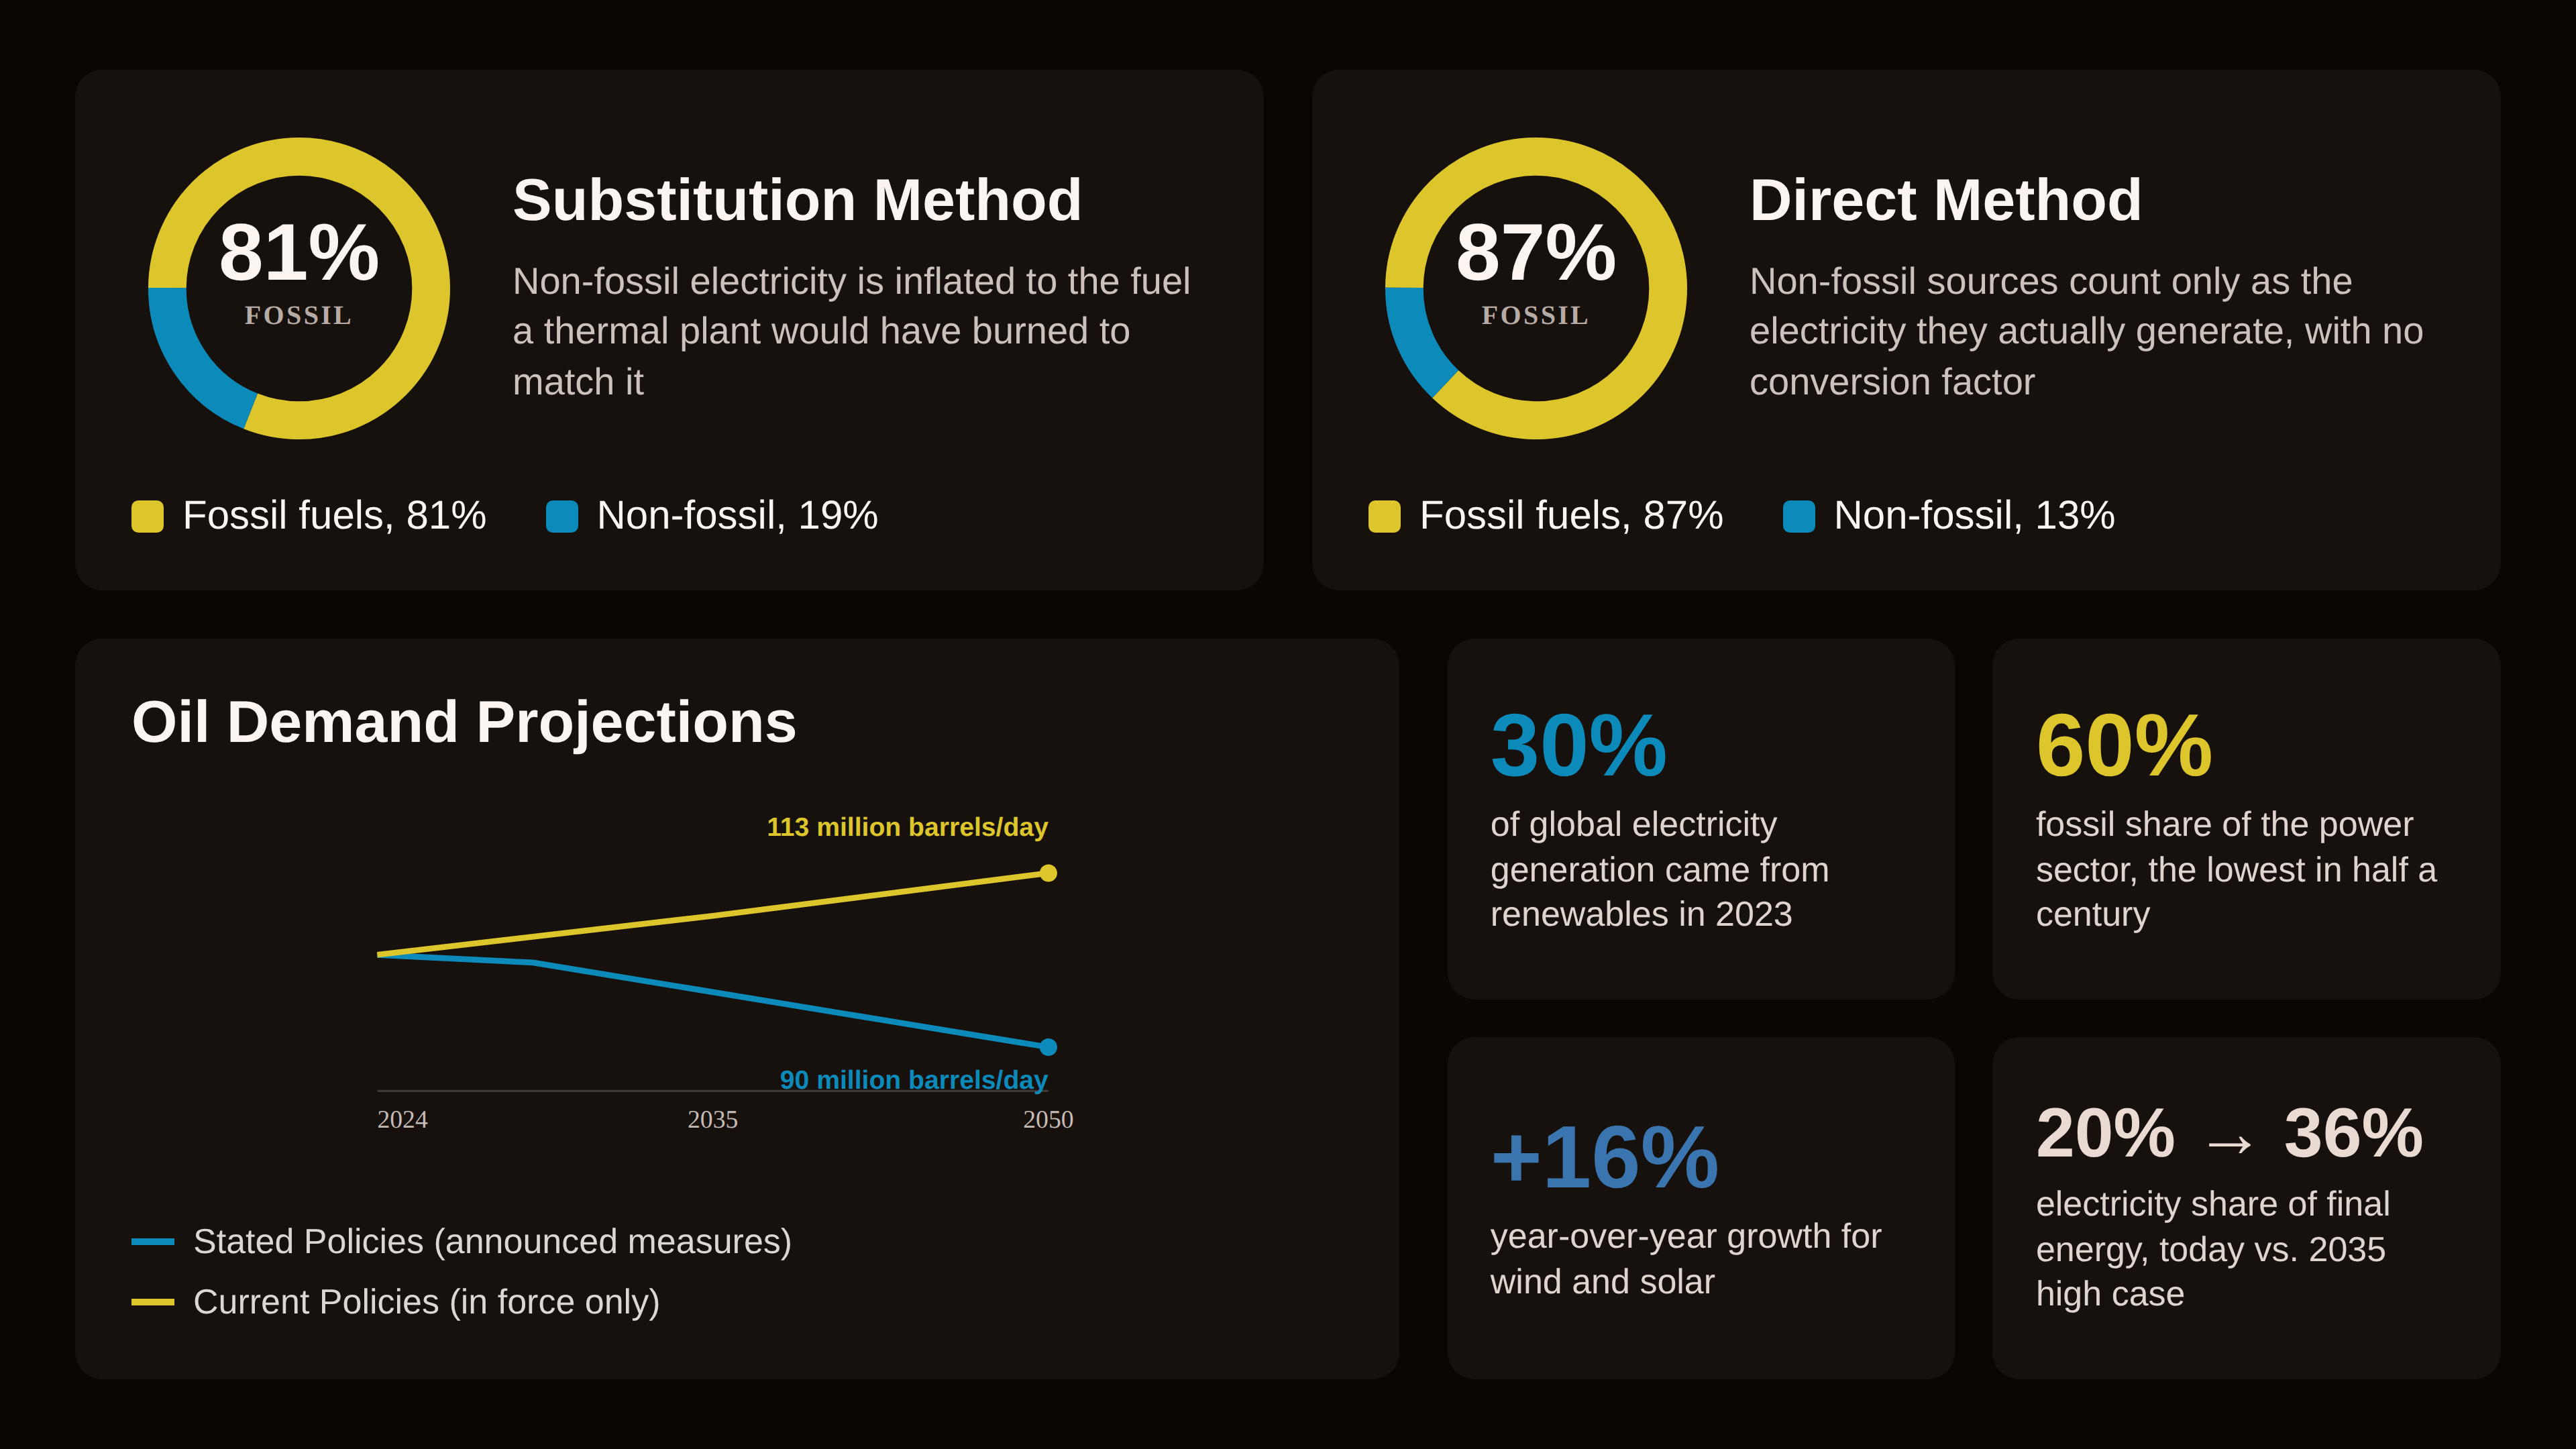
Renewables have grown quickly in relative terms while barely moving the overall balance. Wind and solar were the fastest-growing sources, expanding around 16 percent year over year, and non-fossil sources together reached roughly 13.5 percent of the mix on a direct basis or about 14.6 percent including hydro on a substitution basis. The critical detail is that this growth has so far been added on top of rising fossil consumption rather than displacing it. In 2024 both fossil fuel use and renewable generation set record highs in the same year. That is the historical pattern repeating: new capacity layered onto old rather than swapped for it.
The one place the substitution is visibly happening is electricity specifically. Ember's Global Electricity Review put renewables at about 30 percent of global electricity generation in 2023, pushing the fossil share of the power sector down to around 60 percent, its lowest in half a century. That shift is being driven as much by cost as by policy: IRENA's Renewable Power Generation Costs and Lazard's Levelized Cost of Energy analysis both now show utility-scale solar and onshore wind as the cheapest new-build generation in most markets, before subsidy.
Electricity, though, is only about a fifth of final energy consumption. The transition is real in the power sector and much slower everywhere else, particularly in heat, heavy industry, aviation, and shipping, the four areas the IEA groups under hard-to-abate emissions precisely because no drop-in electric substitute exists yet at scale.
What the projections actually say
Here the picture has shifted noticeably even within the last year, and it is worth being precise rather than picking a single headline. The major forecasters agree that clean energy is growing faster than at any point in modern history, but they disagree sharply on how quickly fossil fuels decline from their peak.
The International Energy Agency's Stated Policies Scenario, which incorporates policies governments have actually announced, has for several years projected that demand for all three fossil fuels would peak before 2030, with oil flattening around 102 million barrels per day near the end of this decade before gradually declining. In that scenario, laid out in the World Energy Outlook, solar and wind exceed 40 percent of electricity generation by 2035 and approach 60 percent by 2050, while nuclear holds near 10 percent throughout.
That projection is no longer the only official view. In its 2025 outlook the IEA reintroduced a Current Policies Scenario, reflecting only measures already in force, in which oil and gas demand keep growing all the way to 2050, with oil reaching as high as 113 million barrels per day by mid-century. The gap between these two scenarios is not a modeling nuance; it is the difference between a fossil peak this decade and no peak at all before 2050, and which one materializes depends almost entirely on whether announced policies get implemented. It is also instructive to read the IEA alongside the producer-side outlooks, notably OPEC's World Oil Outlook and BP's Energy Outlook, which have historically bracketed the IEA on either side. The honest summary is that the peak is now a question of policy follow-through rather than technical capability.
What every scenario shares is a large and rising role for electricity. The share of electricity in final energy consumption is projected to climb from about 20 percent today toward 26 to 36 percent by 2035 depending on the scenario, driven by electric vehicles, heat pumps, and rapidly growing data center demand, the last of which the IEA treated as a standalone forecasting problem for the first time in Energy and AI. Even the most fossil-heavy projections assume electricity grows faster than total energy demand, which steadily erodes the fossil share of the power sector regardless of what happens to absolute fossil volumes.
The pattern underneath two hundred years of data
Looked at across the full span, a few things stay consistent. Energy transitions have always been slow, measured in decades even when a clearly superior source was available, because energy infrastructure is long-lived and demand keeps growing underneath the transition. New sources have historically been added on top of old ones rather than replacing them, which is exactly what is happening now with renewables and fossil fuels both hitting records in the same years. And percentage share and absolute volume can move in opposite directions, so a fuel can be losing its share of the mix while still growing in the amount consumed, which is the current trajectory for coal in much of the world and potentially for oil under the more conservative scenarios.
The current transition is genuinely different in one respect: it is being driven deliberately by policy and climate concern rather than purely by a new source being cheaper or more useful, and the low-carbon sources are being deployed faster than any previous entrant. Solar in particular has followed a learning curve steep enough that its cost declines have repeatedly outrun the forecasts, including the IEA's own. But the underlying physics of the transition, the multi-decade timescale, the long-lived infrastructure, the demand growth underneath, are the same constraints that governed every shift before it.
Why this matters for the infrastructure being built
The common thread across all of these scenarios, whether fossil fuels peak this decade or keep growing to 2050, is that enormous quantities of energy infrastructure get built either way. Under a fast transition, that means solar farms, wind installations, grid expansion, hydrogen plants, and carbon capture facilities. Under a slow one, it means continued LNG terminals, gas processing, and refining capacity. Under any realistic scenario, it means both at once for decades. Nearly all of it runs on the same core engineering disciplines: pressure vessels, piping, heat exchangers, rotating equipment, and the code-driven calculation and documentation work that underpins every plant regardless of what it processes. A hydrogen electrolyser skid, an LNG train, and a nuclear balance-of-plant are different processes wrapped around the same ASME Section VIII arithmetic.
That is the part of the energy system DeepMechanix is built to serve. Whichever way the energy mix tilts over the coming decades, the engineering work of designing and certifying that infrastructure to code does not go away, and making that work faster and fully traceable is useful across every scenario rather than tied to any single one winning out.
Frequently asked questions
Why do sources disagree on the fossil fuel share of energy? Because there are two accounting conventions. The direct method counts non-fossil electricity as the energy it actually delivers, giving a 2024 fossil share near 87 percent. The substitution method scales that electricity up by the fuel a thermal plant would have burned to produce it, giving roughly 81 percent. Both describe the same physical system.
Has any energy source ever been fully replaced? Not globally. Biomass, coal, oil, and gas are all still consumed in larger absolute quantities today than at most points in their history. What changes is each source's share of a growing total, not its disappearance.
When do fossil fuels peak? It depends on which IEA scenario you read. Stated Policies puts the peak for all three fossil fuels before 2030; Current Policies, reintroduced in the 2025 outlook, has oil and gas still growing in 2050. The difference is policy implementation, not technology.
How fast are renewables actually growing? Wind and solar grew about 16 percent year over year, the fastest of any source, and renewables supplied roughly 30 percent of global electricity in 2023. The caveat is that electricity is only about a fifth of final energy consumption, so rapid growth in the power sector moves the total mix slowly.
Why do energy transitions take so long? Energy assets last thirty to sixty years, supply chains and skilled labor scale on their own timescales, and total demand keeps growing underneath the transition, so new capacity is absorbed by growth before it displaces anything. Historical transitions took fifty years or more even when the incoming fuel was clearly superior.
Data cited reflect the referenced Energy Institute, Ember, IRENA, and IEA publications as of mid-2026. Scenarios are projections, not forecasts, and the IEA is explicit that its scenarios are not predictions of what will happen.